How Many People Are on Benefits in the UK? Official 2026 Statistics
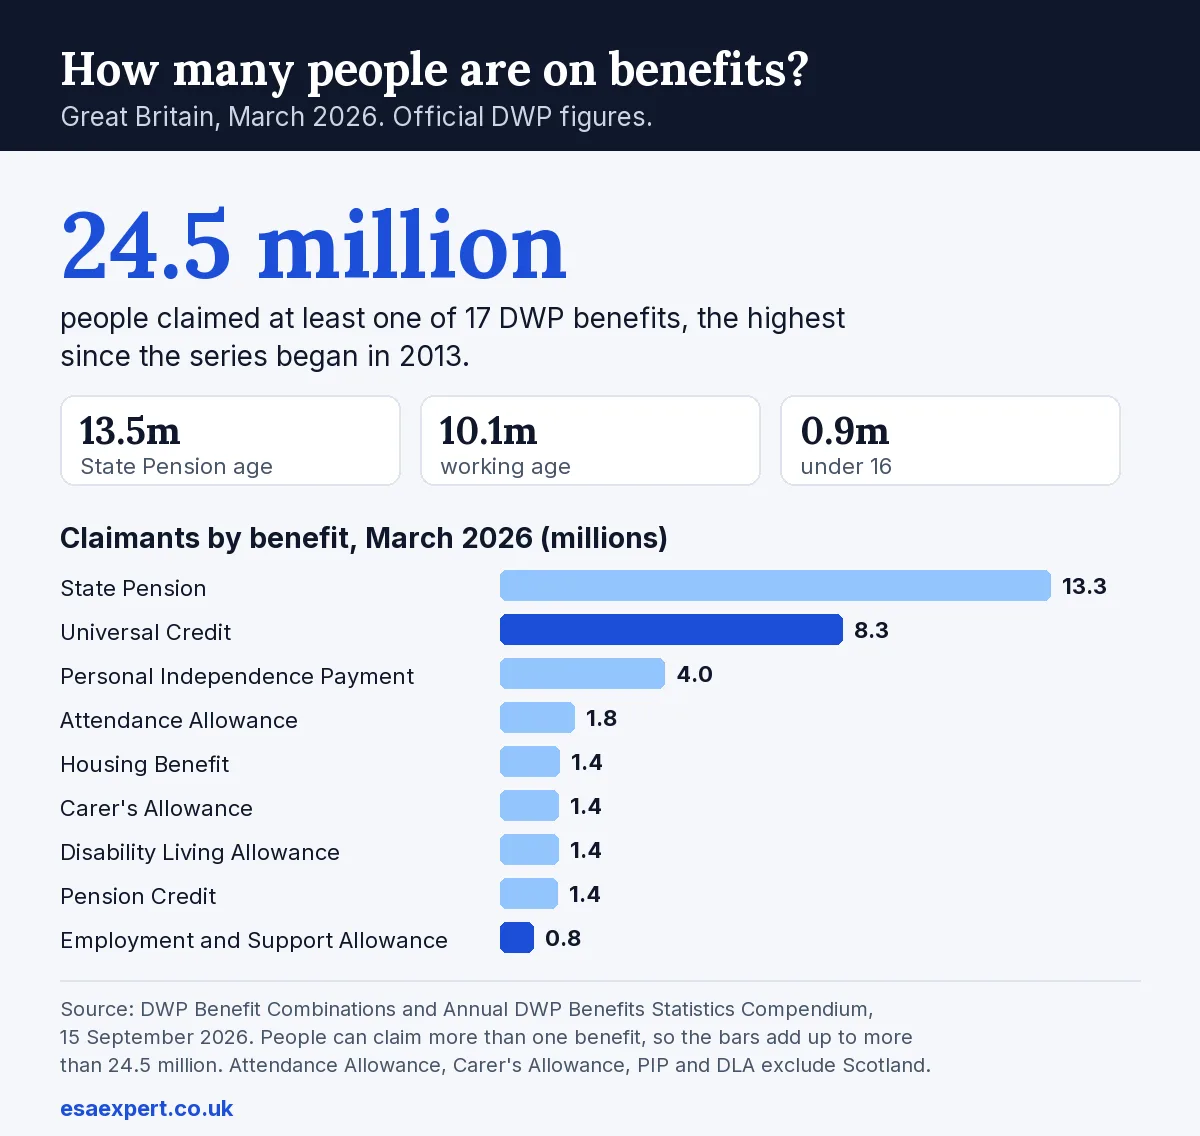
24.5 million people in Great Britain claimed at least one DWP benefit in March 2026, the highest number since the DWP's count began in 2013, according to the Benefit Combinations statistics to March 2026. More than half of them, 13.5 million, were over State Pension age, and most of those get the State Pension. 10.1 million were of working age. This page sets out the official figures behind the question "how many people are on benefits?": the total, each main benefit, the share of families on benefits, Universal Credit, Universal Credit for people with a health condition, Employment and Support Allowance (ESA) and the Work Capability Assessment. Every number sits next to the publication it comes from, the period it covers and the area it describes.
Last updated: 19 November 2026. Every figure below was copied from the original publication on that date.
Next update due: 15 December 2026, when the DWP publishes Universal Credit Health statistics to September 2026 and the ESA Work Capability Assessment statistics for December 2026 (both confirmed on the GOV.UK statistics calendar). Universal Credit figures to November 2026 follow on 16 February 2027.
Coverage: DWP counts cover Great Britain (England, Wales and Scotland). The Family Resources Survey covers the whole United Kingdom. Each table says which.
Key benefit statistics at a glance
Ten facts, each with its period and source.
- 24.5 million people claimed at least one of 17 DWP benefits in Great Britain in March 2026, the highest level since the series began in 2013. DWP, Benefit Combinations to March 2026 (15 Sep 2026)
- Of them, 13.5 million were of State Pension age, 10.1 million of working age and 900,000 were children under 16 getting Disability Living Allowance. DWP, Benefit Combinations to March 2026
- 54% of families in the United Kingdom received some state support in 2024 to 2025, including the State Pension and Child Benefit; 46% received none. DWP, Family Resources Survey 2024 to 2025 (26 Mar 2026), table 2.8
- 8.4 million people were on Universal Credit in August 2026, up from 8 million a year earlier. DWP, Universal Credit statistics to 13 August 2026 (17 Nov 2026)
- 51.4% of people on Universal Credit in August 2026 were in the no work requirements group, and 37.6% were in work or self-employment in July 2026. DWP, Universal Credit statistics to 13 August 2026
- 3.6 million people were on Universal Credit health in June 2026, 43% of everyone on Universal Credit; 2.8 million of them had LCWRA. DWP, Universal Credit Health statistics to June 2026 (15 Sep 2026)
- 53% of Universal Credit Work Capability Assessment decisions in the three months to May 2026 were LCWRA, down from 81% a year earlier. DWP, Universal Credit Health statistics to June 2026
- About 810,000 people were on ESA in March 2026, 39% fewer than in February 2025; 680,000 of them were in the Support Group. DWP, Annual DWP Benefits Statistics Compendium 2026 (15 Sep 2026)
- 4.7 million working-age people in England and Wales claimed an incapacity or disability benefit in March 2026, up from 2.9 million in May 2019. DWP, Benefit Combinations to March 2026
- 4.1 million people were entitled to Personal Independence Payment (PIP) in England and Wales at 31 July 2026. DWP, PIP statistics to July 2026 (15 Sep 2026)
How many people are on benefits in Great Britain?
The DWP counts each person once, however many of its benefits they get. In March 2026 that count reached 24.5 million. The DWP's summary rounds the same figure to 25 million. From 2013 to early 2020 the count stayed at around 20 to 21 million. It peaked at 23.0 million in February 2021 during the pandemic, dipped to 22.4 million by February 2022 and has risen since.
| Measure | Figure | Period and area |
|---|---|---|
| All people claiming a DWP benefit | 24.5 million | March 2026, Great Britain |
| of State Pension age | 13.5 million | March 2026, Great Britain (+2% on Feb 2025) |
| of working age | 10.1 million | March 2026, Great Britain (+1% on Feb 2025) |
| under 16 (Disability Living Allowance) | 900,000 | March 2026, Great Britain (+15% on Feb 2025) |
| in England and Wales | 22.7 million | March 2026, includes unknown and abroad |
| in Scotland | 1.8 million | March 2026, DWP benefits only |
| Pandemic peak | 23.0 million | February 2021, Great Britain |
| Before the pandemic | 20.0 to 21.0 million | February 2013 to February 2020 |
Source: DWP, Benefit Combinations: Official Statistics to March 2026, section 1, published 15 September 2026.
What it means: one person counts once, so a pensioner with Attendance Allowance and Pension Credit is one of the 24.5 million. The total is driven by the State Pension: more than half of the people counted are over State Pension age. In England and Wales, 30% of claimants over State Pension age and 36% of working-age claimants got more than one benefit.
What the total does not include
The 24.5 million is the best official answer, but it is not a full UK count. It leaves out:
- Northern Ireland, where benefits are run by the Department for Communities and counted separately.
- Scottish disability and carer benefits run by Social Security Scotland, such as Adult Disability Payment, Child Disability Payment, Pension Age Disability Payment and Carer Support Payment. Our sister site ADPexpert covers Adult Disability Payment.
- HMRC benefits, such as Child Benefit, which is paid to families by HMRC, not the DWP.
- Council Tax Reduction and other help run by local councils.
Because these sources count different things on different dates, no official UK-wide figure for "people on benefits" exists, and this page does not add them up.
How many people claim each benefit?
This table counts claimants of each benefit separately, so people with two or more benefits appear more than once. That is why the rows add up to far more than 24.5 million.
| Benefit | Claimants | Area |
|---|---|---|
| State Pension | 13,308,000 | Great Britain |
| Universal Credit | 8,289,000 | Great Britain |
| Personal Independence Payment | 3,980,000 | England and Wales* |
| Attendance Allowance | 1,803,000 | England and Wales* |
| Housing Benefit | 1,447,000 | Great Britain |
| Carer's Allowance | 1,408,000 | England and Wales* |
| Disability Living Allowance | 1,404,000 | England and Wales* |
| Pension Credit | 1,382,000 | Great Britain |
| Employment and Support Allowance | 812,000 | Great Britain |
| Jobseeker's Allowance | 77,000 | Great Britain |
Source: DWP, Annual DWP Benefits Statistics Compendium: 2026, figure 1, rounded to the nearest thousand. *Excludes Scotland, where these benefits have been replaced by Scottish benefits.
What it means: Universal Credit is now the largest working-age benefit by far. From February 2025 to March 2026, Housing Benefit fell by 23.2%, ESA by 39.0% and Jobseeker's Allowance by 5.0%, as Universal Credit replaced their working-age means-tested parts.
What percentage of people in the UK are on benefits?
The DWP does not publish the share of the population on benefits. The nearest official measure is from the Family Resources Survey, a household survey of the whole United Kingdom. It counts families (a single adult or a couple, with any children), not individual people. In 2024 to 2025, 54% of UK families received some form of state support, up from 53% the year before. That includes the State Pension and Child Benefit, which many families get whatever their income. 24% of families received an income-related benefit, the kind that depends on low income, such as Universal Credit or Pension Credit.
| State support | UK | England | Wales | Scotland | N. Ireland |
|---|---|---|---|---|---|
| Any state support | 54% | 53% | 61% | 56% | 59% |
| Any income-related benefit | 24% | 24% | 27% | 27% | 22% |
| State Pension | 24% | 24% | 27% | 25% | 23% |
| Child Benefit | 16% | 16% | 17% | 15% | 21% |
| Universal Credit | 14% | 14% | 15% | 15% | 14% |
| PIP (daily living part) | 9% | 8% | 12% | 9% | 15% |
| Employment and Support Allowance | 3% | 3% | 3% | 4% | 6% |
Source: DWP, Family Resources Survey: financial year 2024 to 2025, published 26 March 2026, income and state support tables, table 2.8. Interviews April 2024 to March 2025.
What it means: "54%" is a share of families, not of people, and it includes pensions. 46% of families, about 17 million of 36.7 million, received no state support at all. State support made up 16% of all gross household income in the UK; 72% came from work.
How many people are on Universal Credit?
Universal Credit has replaced six older means-tested benefits for working-age people, and the move is now close to complete. That explains much of its growth: between December 2023 and December 2025 the number of people on Universal Credit rose by 2 million, and 1.6 million of that rise came from people moved across from older benefits. Between January and August 2026 it rose by only 50,000.
| Measure | Figure | Period |
|---|---|---|
| People on Universal Credit | 8.4 million | August 2026 |
| Same measure a year earlier | 8 million | August 2025 |
| Households on Universal Credit | 7.2 million | August 2026 |
| of which with a payment | 6.7 million (93%) | August 2026 |
| No work requirements group | 4.3 million (51.4%) | August 2026 |
| Searching for work group | 1.6 million | August 2026 |
| In work or self-employed | 3.1 million (37.6%) | July 2026 |
| Joined through Move to Universal Credit | 1.7 million (19.8%) | August 2026 |
| New claims per week (average) | 41,000 | August 2026 (58,000 in August 2025) |
| Women / median age | 56.9% / 41 | August 2026 |
Source: DWP, Universal Credit quarterly statistics, 29 April 2013 to 13 August 2026, sections 1 and 3, published 17 November 2026. Next release 16 February 2027.
What it means: being on Universal Credit does not mean being out of work. More than a third of people on it were in work or self-employed in July 2026. The no work requirements group overtook searching for work as the largest group in April 2022, which the DWP says happened mainly as people moved across from older benefits, in particular from ESA.
The move from ESA to Universal Credit, and what it means for an existing claim, is explained in our guide to managed migration from ESA to Universal Credit.
How many people get Universal Credit for a health condition?
The DWP calls this group "UC health": people on Universal Credit with a health condition or disability that restricts their ability to work. It includes people waiting for a Work Capability Assessment decision with a fit note, people found to have limited capability for work (LCW) and people found to have limited capability for work and work-related activity (LCWRA), who get the extra health amount.
| Measure | Figure | Share |
|---|---|---|
| People on Universal Credit health | 3.6 million | 43% of all people on Universal Credit |
| Change in a year | +680,000 | +23% on June 2025 |
| LCWRA | 2.8 million | 78% |
| LCW | 440,000 | 12% |
| Waiting for a decision, with medical evidence | 350,000 | 10% |
| Moved across from ESA | 1.3 million | 36% |
| Subject to the new lower LCWRA rate | 800 | June 2026 |
| UC health or ESA combined | 3.9 million | March 2026, +5% on Feb 2025 |
Source: DWP, Universal Credit Health statistics, April 2019 to June 2026, sections 1, 3 and 6, published 15 September 2026. Next release 15 December 2026.
What it means: most of the growth came from people moving from ESA; the DWP says 66% of the rise in the year to June 2026 was ESA transitions. Only 800 people were subject to the new lower LCWRA rate from April 2026; the DWP says almost all others on the LCWRA caseload in June 2026 had protected status at the higher rate. Our LCWRA rates guide explains who gets which rate.
Share of Universal Credit claimants on UC health, by region
| Region or country | June 2025 | June 2026 |
|---|---|---|
| Scotland | 46% | 52% |
| Wales | 44% | 50% |
| North East | 42% | 48% |
| North West | 39% | 46% |
| South West | 39% | 45% |
| Yorkshire and The Humber | 38% | 44% |
| East Midlands | 37% | 43% |
| East of England | 35% | 41% |
| West Midlands | 34% | 40% |
| South East | 34% | 39% |
| London | 29% | 35% |
Source: DWP, Universal Credit Health statistics, April 2019 to June 2026, figure 3.
What it means: every region rose by five to seven percentage points in a year. The share compares UC health with everyone on Universal Credit in the same area, so it also depends on how many people there claim Universal Credit for other reasons, such as low pay.
Work Capability Assessment outcomes
The Work Capability Assessment decides whether someone has LCW, LCWRA (the Support Group on ESA) or neither. Since April 2019 the DWP has made 4.7 million Universal Credit assessment decisions. The more recent figures show a sharp change: in the three months to May 2026, 53% of decisions were LCWRA, against 81% a year earlier. The DWP's figures point to one reason: in the three months to May 2025, 56% of decisions were for people moving across from ESA, a group that mostly ends up with LCWRA (82% of their decisions in the latest quarter); in the three months to May 2026 that share was down to 10%.
| Measure | Figure | Period |
|---|---|---|
| Universal Credit decisions made | 4.7 million | April 2019 to May 2026 |
| of which LCWRA / LCW / not limited | 71% / 16% / 13% | April 2019 to May 2026 |
| Universal Credit decisions that were LCWRA | 53% | 3 months to May 2026 (81% a year earlier) |
| ESA assessments completed | 15,000 | 3 months to March 2026 (12,000 initial, 2,200 repeat) |
| Initial ESA decisions: Support Group / WRAG / fit for work | 63% / 11% / 26% | 3 months to March 2026 |
| Initial ESA decisions found fit for work, a year earlier | 17% | 3 months to March 2025 |
| Median end to end clearance time, initial ESA assessments | 112 weekdays | March 2026 |
| ESA mandatory reconsiderations registered / revised | 190 / 78% | July 2026 |
Sources: DWP, Universal Credit Health statistics to June 2026, sections 1 and 5; DWP, ESA: outcomes of Work Capability Assessments, September 2026, sections 1 to 6. Both published 15 September 2026; next releases 15 December 2026.
What it means: these percentages describe decisions already made for a whole group of people. They do not predict the outcome of any one claim, which depends on the descriptors and the evidence. ESA mandatory reconsideration numbers are now very small, so the monthly share revised can swing a lot. For waiting times see our WCA backlog guide, and for tribunal results see our ESA appeal guide.
How many people are on ESA?
ESA has fallen fast. Income-related ESA closed to new claims in January 2021 and almost everyone on it has now moved to Universal Credit, so by March 2026 only 1,900 people were getting income-related ESA on its own. New Style ESA, which depends on National Insurance contributions, carries on, and some people claim it alongside Universal Credit.
| Measure | Figure | Note |
|---|---|---|
| People on ESA | 810,000 | Down 520,000 (39%) since February 2025 |
| Support Group | 680,000 | No work-related activity required |
| Work-Related Activity Group | 27,000 | Limited capability for work |
| Assessment phase | 58,000 | Waiting for a Work Capability Assessment decision |
| Contribution-based ESA only | 730,000 | Up 250,000 since February 2025 |
| Income-related ESA only | 1,900 | Down 500,000 since February 2025 |
| Former Incapacity Benefit claimants | 300,000 | Moved to ESA from Incapacity Benefit |
Source: DWP, Annual DWP Benefits Statistics Compendium: 2026, section 5, published 15 September 2026. The DWP rounds the total to 810,000 in its text (811,800 in figure 2). Next release 21 September 2027.
What it means: the DWP's groups do not add up exactly to the total, and the former Incapacity Benefit count overlaps them. The other people on ESA get both contribution-based and income-related ESA, or National Insurance credits only. The ESA fall does not mean fewer people are ill: most of them now get the same help through Universal Credit, shown above. Our guide to ESA and Universal Credit together explains how the two fit.
Incapacity and disability benefits together
The Benefit Combinations statistics also look at working-age people in England and Wales who get an incapacity benefit (ESA, Incapacity Benefit or Severe Disablement Allowance), Universal Credit health or a disability benefit (PIP or Disability Living Allowance). In March 2026 there were 4.7 million, 6% more than in February 2025 and up from 2.9 million in May 2019.
| Group | People |
|---|---|
| All with an incapacity or disability benefit | 4.7 million |
| Both PIP or DLA and an incapacity benefit or UC health | 2.2 million |
| Incapacity benefit or UC health, no PIP or DLA | 1.2 million |
| PIP or DLA, no incapacity benefit or UC health | 1.2 million |
| On the UC health journey (May 2019: 370,000) | 3.1 million |
| ESA, IB or SDA without UC health (May 2019: 1.8 million) | 340,000 |
| Universal Credit (no work requirements) and PIP or DLA, with no other benefit | 1,377,000 (15% of working-age claimants) |
Source: DWP, Benefit Combinations: Official Statistics to March 2026, sections 2 and 3, published 15 September 2026.
What it means: part of the rise is how the group is counted. The DWP explains that people on older benefits other than ESA, Incapacity Benefit or Severe Disablement Allowance were never in this count, but are now included if they move to Universal Credit and are on UC health. 12% of people on the UC health journey also had an ESA claim at the same time (New Style ESA can be paid alongside Universal Credit), up from 5% in May 2019. Getting PIP does not by itself give LCWRA or the Support Group, as our guide to ESA and PIP together explains.
PIP figures
4.1 million people were entitled to PIP in England and Wales at 31 July 2026, and 37% of them had the highest award (both parts at the enhanced rate), according to the DWP's PIP statistics to July 2026. Our sister site PIPexpert keeps the full set of figures, including award rates, waiting times, reconsiderations and tribunals, on its PIP statistics 2026 page.
Frequently Asked Questions
How many people are on benefits in the UK?
The closest official count is for Great Britain: 24.5 million people claimed at least one of 17 DWP benefits in March 2026, according to the DWP Benefit Combinations statistics. 13.5 million were of State Pension age, 10.1 million of working age and 900,000 were children under 16 getting Disability Living Allowance. The count includes the State Pension. It does not include Northern Ireland, the disability and carer benefits run by Social Security Scotland or HMRC benefits such as Child Benefit, so there is no single official UK total.
What percentage of people in the UK are on benefits?
The Family Resources Survey measures families rather than people. In 2024 to 2025, 54% of families in the United Kingdom received some form of state support, including the State Pension and Child Benefit, and 46% received none. 24% of families received an income-related benefit such as Universal Credit or Pension Credit. The share was 53% in England, 61% in Wales, 56% in Scotland and 59% in Northern Ireland.
How many people are on Universal Credit?
8.4 million people were on Universal Credit in Great Britain in August 2026, up from 8 million in August 2025 and the highest level since Universal Credit started in 2013. They were in 7.2 million households, of which 6.7 million had a payment. 51.4% of people on Universal Credit were in the no work requirements group and 37.6% were in paid work or self-employment in July 2026.
How many people on Universal Credit have a health condition?
3.6 million people were on Universal Credit health in Great Britain in June 2026, 43% of everyone on Universal Credit. Of these, 2.8 million (78%) had been found to have limited capability for work and work-related activity (LCWRA), 440,000 (12%) had limited capability for work (LCW) and 350,000 (10%) were waiting for a decision with medical evidence.
How many people are on ESA?
About 810,000 people were on Employment and Support Allowance in Great Britain in March 2026, 39% fewer than in February 2025, as income-related ESA claims moved to Universal Credit. 680,000 were in the Support Group, 27,000 in the Work-Related Activity Group and 58,000 in the assessment phase. 730,000 were getting contribution-based ESA only.
Where do UK benefit statistics come from?
Counts of claimants come from DWP administrative records, published on GOV.UK and on the DWP Stat-Xplore tool. The share of families on benefits comes from the Family Resources Survey, a household survey for the whole United Kingdom. The next updates on this page are due on 15 December 2026 (Universal Credit health and ESA assessment statistics) and 16 February 2027 (Universal Credit statistics to November 2026).
How to cite this page
Suggested citation
ESAexpert (2026). How Many People Are on Benefits in the UK? Official 2026 Statistics. Updated 19 November 2026. https://www.esaexpert.co.uk/blog/how-many-people-on-benefits-uk.html
Plain URL
https://www.esaexpert.co.uk/blog/how-many-people-on-benefits-uk.html
The tables on this page are free to reuse with a link back to this page. Each section has its own anchor (for example #universal-credit or #uc-health) for deep links. The underlying data are Crown copyright under the Open Government Licence, so please name the original publication too, as shown under each table.
Sources and release dates
| Publication | Covers | Released | Next release |
|---|---|---|---|
| DWP: Annual DWP Benefits Statistics Compendium 2026, with Benefit Combinations | Great Britain, to March 2026 | 15 Sep 2026 | 21 Sep 2027 |
| DWP: Universal Credit statistics to 13 August 2026 | Great Britain, to August 2026 | 17 Nov 2026 | 16 Feb 2027 |
| DWP: Universal Credit Health statistics to June 2026 | Great Britain, April 2019 to June 2026 | 15 Sep 2026 | 15 Dec 2026 |
| DWP: ESA outcomes of Work Capability Assessments, September 2026 | Great Britain, to July 2026 | 15 Sep 2026 | 15 Dec 2026 |
| DWP: Family Resources Survey 2024 to 2025 | United Kingdom, April 2024 to March 2025 | 26 Mar 2026 | March 2027 (provisional) |
| DWP: PIP statistics to July 2026 | England and Wales, to 31 July 2026 | 15 Sep 2026 | 15 Dec 2026 |
| DWP Stat-Xplore | Unrounded data by area, age and benefit | Updated with each release | 15 Dec 2026 |
Guidance only, not legal advice. Figures are copied from the publications above as published; the DWP rounds most of them and may revise them in later releases. Facts verified 19 November 2026.
Need help with your WCA50 form?
ESAexpert generates personalised WCA50 answers for all 17 activities based on your specific conditions. You can try one activity completely free to see what it produces.